Feature Friday – How New Dashboard Updates Can Improve Your Testing
 Jerin Mathew
“Progress is impossible without change.” These are words spoken by Walt Disney, one of the most culturally influential men to walk the Earth. These are words that Qyrus personifies and that our amazing minds here live by. Change is what makes the world go round, and what keeps us writing these amazing Feature Fridays! This week we are joined by Tim, Jorell, and Linto to go over some changes that are coming to our main page’s dashboard. Let’s hear about how these changes can help you!
Tell us more about updates to analytics and insights on Qyrus.
Tim:
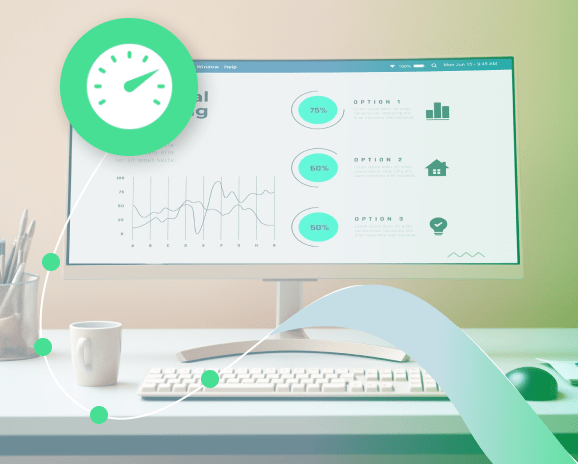
Well, for starters, the first thing you might notice is the update to the main dashboard. Previously, we were making little use of the available space on the dashboard. Now, we’ve changed that. You’re able to access information on passing versus failing rates across different projects, the total number of tests built and executed across the team, and a list of tests recently worked on.
Jorell:
Furthermore, we’re able to see daily contributions and login activity on a specific team, allowing team members to collaborate more efficiently. Users can also get a quick overview of their infrastructure setup. Lastly, on the page, you’ll see we’ve added a checklist to keep track of things to do.
Linto:
We’ve found that overall, this update helps improve the user experience of the platform’s main dashboard, specifically in terms of navigation. We’ve moved the list of services from the main part of the page to be part of a collapsible sidebar, now. That way, the most important things are in your face first.
How can this impact the testing process?
Jorell:
Well, in general, there’s an impact in the area of reporting and analytics. There’s a lot more offered to the user to analyze the testing results across projects and teams. Instead of having to navigate all the way to a specific test’s report, we can view those details directly on the dashboard.
Tim:
It gives us a better general overview of the testing ecosystem. We can specifically target Web projects, Mobile projects, or API projects on the dashboard. Overall, we can see how the amount of time spent viewing and analyzing a larger amount of reports might be impacted.
What kind of possible improvements or extra features might we see added in the future?
Linto:
Adding more customizable widgets is one thing we’ve brainstormed, like providing more choices for the user to make the dashboard their own and tailor it to their needs.
Jorell:
For example, one user might not require such a large overview of an entire team or project, but rather something more granular. We want to enable users to customize their dashboards to help them become more efficient.
How might these updates help testers, developers, and business technologists? What value can this feature bring?
Tim:
This is exactly where customization would come in handy! No matter what role you play, the dashboard can play to your needs. Testers and developers might quickly see the data on passing and failing rates in projects. But they can also get a quick view of the test infrastructure and its usage. Checklists also come in handy to keep track of tasks directly on the project.
Jorell:
Business technologists could use the dashboard for more business-oriented or managerial tasks, such as checking on the health of projects and testing various applications. They can also get a good overview of team contributions and activity.
How do you see these updates impacting day-to-day operations across organizations?
Jorell:
Well, in general, I would give a better overview of operations, allowing users to spend less time navigating around the platform to view specific reports and results.
Linto:
A user can see the already recently worked on tests, and in that way, they can be prevented from recreating a test that is already existing. Then, they can just clone and reuse it.
Although nothing astronomical, these updates provide proof that Qyrus is an ever-evolving platform, constantly looking to improve the lives and day-to-day of testers using it everywhere. And besides that, we’re committed to keep improving to help you achieve your testing goals more efficiently. Progress never stops, and neither does Qyrus. Thanks for joining us this week, and we hope you enjoy the rest of your Friday!
![Featured_Image-LLM_evaluation[1]](https://www.qyrus.com/wp-content/uploads/2026/03/Featured_Image-LLM_evaluation1.webp)
 March 9, 2026
  9 min
9 min