FinOps: The Complete Guide to Cloud Financial Management, Governance & Optimization
 Varun RS
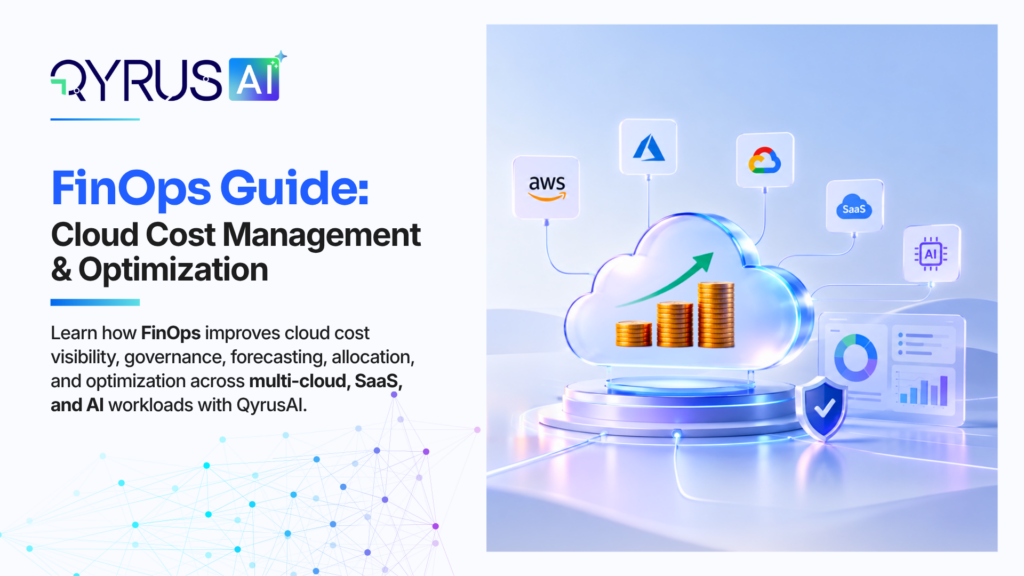
Here is something most people get wrong about FinOps: it is not a software category, and it is not a team that tells engineers to spend less. It is a way of working that brings Finance, Engineering, and Product into the same conversation about cloud costs, in real time, so every dollar of technology spend has a clear owner and a clear purpose.
Think of it the way DevOps changed how companies ship software. DevOps did not replace developers or operations teams. It eliminated the wall between them. FinOps does the same thing for the relationship between engineering decisions and financial outcomes.
What Is FinOps?
FinOps (Financial Operations) is the process of bringing financial accountability to cloud spending by combining engineering, finance, and business perspectives into a single operating model.
In its simplest form: FinOps is cloud cost management done collaboratively. It is not about cost-cutting for its own sake. It is about making intentional, data-driven decisions about cloud spending that balance cost, performance, and business value.
The world 10 years back, for them IT cost was a capacity problem. If you bought a server for $49,000, depreciated it over three years, and the decision was made. If you over-bought, the money was already spent. There was nothing to optimize.
The cloud world is having a consumption problem. An engineer changing an instance type for a few hours of testing just spent $0.384 per hour more than they needed to. Across 400+ engineers doing this daily, that is $1.2 million a year in extra spend with no purchase order, no approval process, and no visibility until the bill arrives.
That is the gap FinOps closes.
What is the difference between FinOps and traditional cost management
Traditional Approach | FinOps Approach |
Finance owns the bill | Finance, Engineering, and Business own cost together |
Cost visibility is monthly | Cost visibility is continuous (hourly/daily) |
Optimization happens after bill arrives | Optimization happens before deployment |
Cost decisions are reactive | Cost decisions are data-driven and proactive |
No clear cost ownership | Every resource has a clear cost owner |
Forecasts are based on historical trend | Forecasts include planned changes and dependencies |
The Finance Teams are struggling to solve this
Finance cannot solve cloud spend alone because they don’t have architectural context (they don’t know if a $7,000/month database is serving 2 users or 0.9 million). Engineering cannot solve it alone because they lack pricing context (they don’t know if the code they just pushed will blow past a commit discount threshold). And Product needs to be in the room too, because they are the ones who can say whether the spend is generating enough business value to justify it.
Let’s put this into perspective: A product team launches a video transcoding feature. Engineering builds it. Finance sees a $40,000 spike. Without FinOps, Finance demands someone turn something off — and the feature breaks. With FinOps, the three teams look at the same data together. Product confirms the feature drove $100,000 in new revenue. The $$$ is not a problem but the cost of profitable growth is and that is the difference FinOps makes.
Why Cloud Costs Are So Difficult to Manage
Cloud pricing sounds simple until you actually try to forecast it.
Cloud pricing is an intentionally complex matrix of instance types, regions, availability zones, storage tiers, and data transfer paths. A single microservice architecture might touch 15 different pricing dimensions.
If a developer adds a 10-millisecond Redis cache call to a shopping cart service. At 10 requests per second during testing, the cost is pennies. On Black Friday, at 10,000 requests per second, that single line of code generates $18,000 in fees. The code worked exactly as designed. The economics did not.
Multi-cloud makes it worse.
Most enterprises do not run on one cloud provider. They run AWS for compute, Azure for enterprise services, GCP for data, and 40 SaaS platforms on top of that. Each one sends bills in different formats — CSV, Parquet, JSON. Each one uses different terminology (AWS calls it a “Resource Group”; GCP calls it a “Project”). Trying to answer “how much did we spend on compute yesterday?” becomes a multi-day data engineering project rather than a quick dashboard query.
And then there is the shared cost problem.
When 15 teams run workloads inside a single Kubernetes cluster, the bill shows one number. Who owns the 40% that is idle? Who owns the pod requesting 4 vCPUs but using only half of one? When shared infrastructure feels like a free resource, teams treat it like one — which is how cloud bills quietly spiral without anyone making a single obvious mistake.
The Core Practices of FinOps
Cost visibility and allocation:
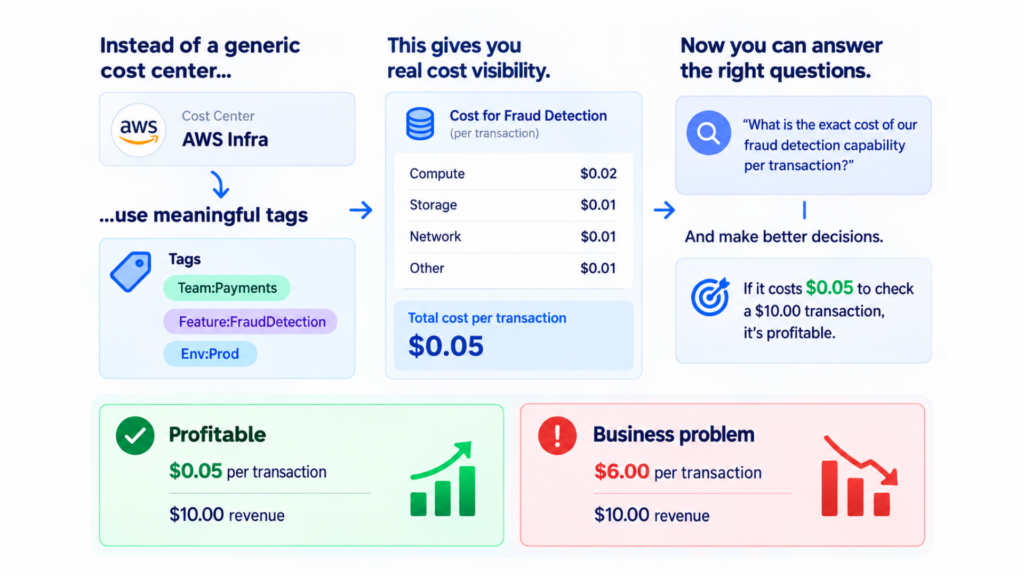
You cannot manage what you cannot measure, and you cannot measure what you cannot attribute. The foundational practice of FinOps is building an accurate allocation model. This moves spend from an unblended lump sum to a chart of accounts mapping to business capabilities.
Example: Instead of labeling a cost center “AWS Infra,” you tag it `Team:Payments`, `Feature:FraudDetection`, `Env:Prod`. This allows you to answer: “What is the exact cost of our fraud detection capability per transaction?” If it costs $0.05 to check a $10.00 transaction, it’s profitable. If it costs $6.00 to check a $10.00 transaction, you have a business problem, not just a tech problem.
Budgeting and forecasting:
Traditional IT budgeting takes last year’s spend, adds 10%, and calls it a forecast. Cloud forecasting does not work that way because the biggest cost changes are not driven by growth. They are driven by planned engineering decisions.
If the Q2 roadmap includes migrating 5TB of Oracle databases to Aurora, the forecast needs to account for dual-running costs during that migration. A historical trend line will completely miss it. The forecast has to start with the engineering plan, not the billing report.
Cost optimization:
Optimization is a three-legged stool:
- Usage optimization: Deleting unattached EBS volumes or stopping dev environments at 7 PM.
- Purchase optimization: Moving from On-Demand to Reserved Instances (RIs), Savings Plans (SPs), or Spot instances.
- Architecture optimization: Re-architecting from a monolithic database to serverless to fundamentally change the cost curve.
Governance that helps engineers move faster, not slower
Most people hear “FinOps governance” and picture a budget approval process that slows engineering down. The goal is the opposite.
Good FinOps governance works like a guardrail on a mountain road — it does not stop you from driving, it prevents the specific crashes that nobody wanted. For example: an engineering team wants to deploy a database in us-east-1. A FinOps policy automatically flags the choice: “Deploying here will cost 12% more due to data transfer egress. us-east-2 would be more efficient.” The engineer makes a more informed decision in 30 seconds. Nobody got blocked; costs went down.
How to Build a FinOps Strategy
Start with clear ownership, Define roles and responsibilities (The RACI):
FinOps succeeds when the friction between teams is eliminated. Define clear swimlanes:
– Engineering: Decides the what (instance type, architecture). Accountable for efficiency.
– Finance/Procurement: Decides the how (commitment discounts, payment terms). Accountable for rate optimization.
– Product/Business: Decides the why (features, SLAs). Accountable for unit economics.
Set budgets, cost targets, and success metrics:
Instead of imposing hard annual budgets (which engineers simply bypass by shifting workloads), set “soft” targets with variance thresholds.
Example: Set a target of $500,000/month for the Data Platform. If spend hits $520,000, no alert. If it hits $550,000 (10% variance), trigger a cost review. If it hits $650,000, trigger an automated escalation. This allows cloud spend to breathe with business demand.
Establish regular cost reviews and accountability:
Move from monthly post-mortems (where Finance yells at Engineering for last month’s bill) to weekly or bi-weekly “Showback” sessions. Example: In a Showback review, the Search Team realizes their OpenSearch cluster is costing $45,000/month, but only serving internal employees. They decide to downgrade the cluster themselves—because they finally saw the data, not because they were forced to.
FinOps Best Practices
Use consistent tagging and cost allocation:
Tagging at the console level is doomed to fail; humans forget. Shift tagging “left” into your Infrastructure as Code (IaC) using policy-as-code tools like Open Policy Agent (OPA) or Checkov.
Example: If a Terraform plan is submitted without a `CostCenter` and `BusinessUnit` tag, the CI/CD pipeline automatically fails the deployment. This guarantees 100% allocation without relying on developer memory.
Monitor spending and detect unusual increases:
A static alert that comes up when spend exceeds $10,000 is not useful in a dynamic cloud environment. It either fires constantly on normal variation or misses the spikes that actually matter.
A $3,000 spike on a Tuesday morning is normal for a B2B SaaS company (batch processing). But a same $3,000 spike on a Sunday afternoon is highly abnormal and likely indicates a compromised API key running crypto-mining. Anomaly detection catches the Sunday spike; static thresholds ignore it or false-alarm on Tuesday.
Automate the work that does not need a human
Not every optimization decision needs a meeting. Shutting down non-production environments at 7 PM every night is not a judgment call — it is a rule. Right-sizing an instance after 14 days of under 15% CPU utilization is not a debate — it is math.
Automating routine optimization frees engineers and FinOps practitioners to focus on decisions that actually require context: architectural changes, commitment strategy, new product cost modeling.
Track savings and ensure they last
The biggest lie in FinOps is “we saved $2M this year.” You right-sized 500 instances, but 3 months later, developers have scaled them back up, and the savings are gone. You must track “Savings Persistence.”
Example: When an instance is right-sized, place a guardrail on that instance type that prevents it from scaling up without a Jira ticket justification. Only count savings as “realized” if they persist for 90+ days.
FinOps Tools and Platforms: What QyrusAI Brings to the Table
Most FinOps platforms give you a dashboard. QyrusAI gives you a intelligent system one that connects cost data, live usage telemetry, system dependency maps, and AI-level attribution into a single platform so Finance, Engineering, and Product can all work from the same picture.
Here is what that looks like in practice, across every capability in the platform.
Anomaly Detection
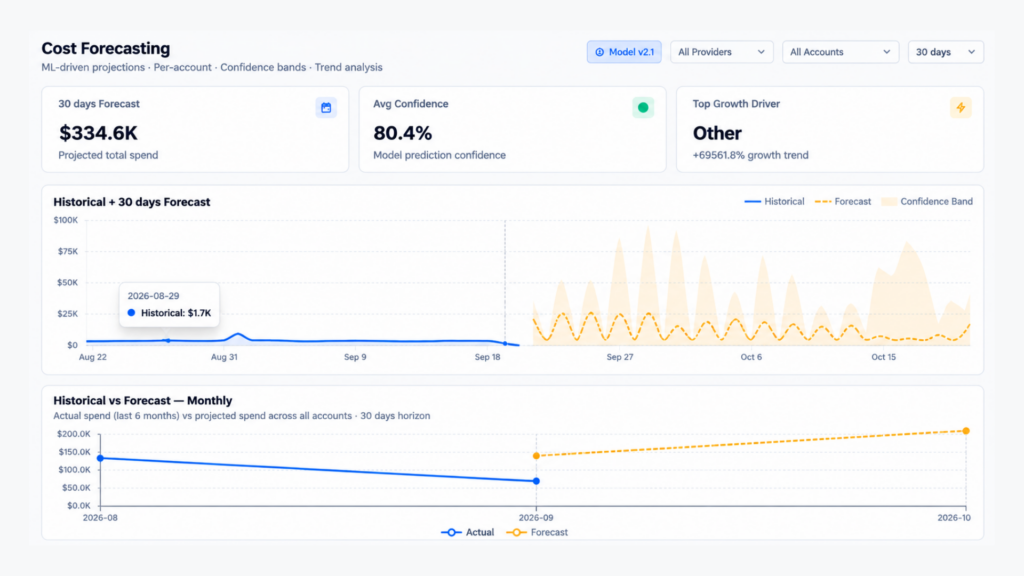
This is the capability that shifts FinOps from reactive to proactive. QyrusAI monitors cost patterns continuously and flags when something moves away from its expected trajectory — before the end of the month, not after.
The difference between useful anomaly detection and noise is baseline intelligence. QyrusAI does not alert on static thresholds. It knows what normal looks like for each service, each team, and each workload — and flags deviations from that baseline specifically. A $3,000 increase that is normal for Tuesday batch processing does not trigger an alert. An identical $3,000 increase on a Sunday that has no corresponding usage event does.
When an anomaly is detected, the platform identifies the likely root cause — whether it is a specific service, a new deployment, a business demand spike, or an infrastructure event — and routes the alert to the team responsible for that cost. The notification arrives with context, not just a number.
Recommendations
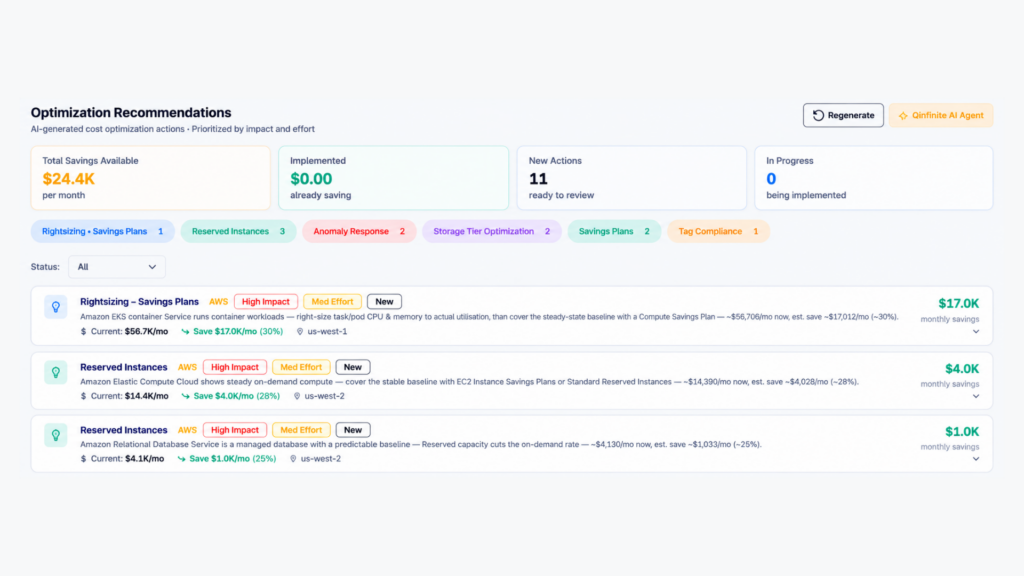
QyrusAI brings cost optimisation recommendations drawn from live telemetry and billing data — rightsizing opportunities, idle resource identification, commitment coverage gaps, and architectural inefficiencies. Each recommendation includes a projected saving, an implementation risk assessment, and the specific action required.
The important detail: Our recommendations are curated, not listed. Rather than presenting 150 suggestions that engineering teams will ignore, QyrusAI filters and prioritises — surfacing the changes with the highest saving-to-effort ratio first, so the team always knows where to start.
FOCUS Explorer
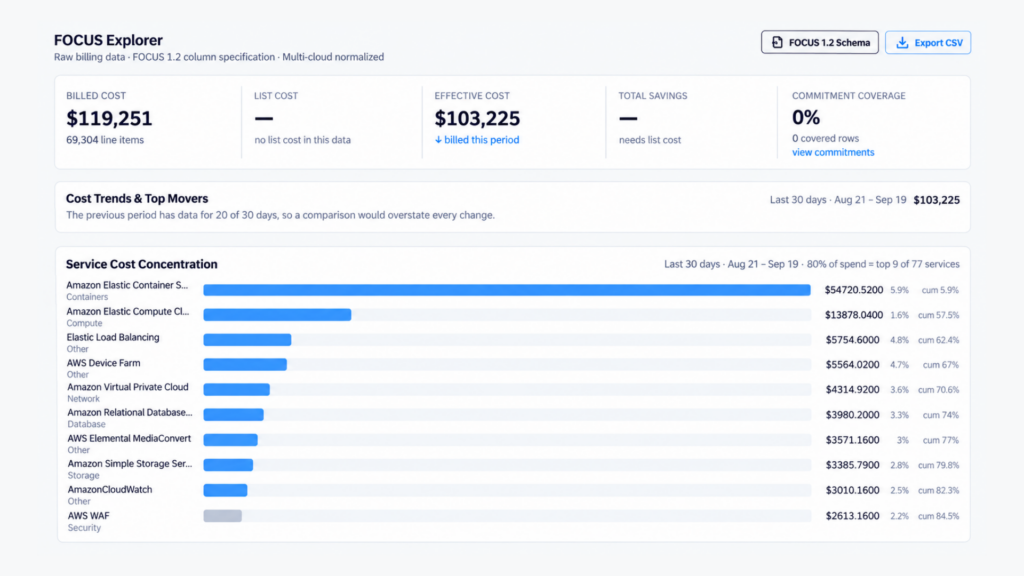
The FOCUS Explorer is the data foundation the whole platform sits on. It normalises cost and usage data from every source — AWS, Azure, GCP, SaaS platforms, on-premises infrastructure, software licences, and AI service providers — into the FOCUS (FinOps Open Cost and Usage Specification) standard schema.
In practical terms, this means a team can compare compute costs from AWS alongside virtual machine costs from Azure, SaaS seat costs from Salesforce, and inference costs from an AI provider — in a single view, using consistent terminology, without a 10-day manual reconciliation process. The FOCUS Explorer lets Finance and Engineering slice and query that unified cost model at any level of granularity: total enterprise, business unit, application, service, or individual resource.
Digital Twin
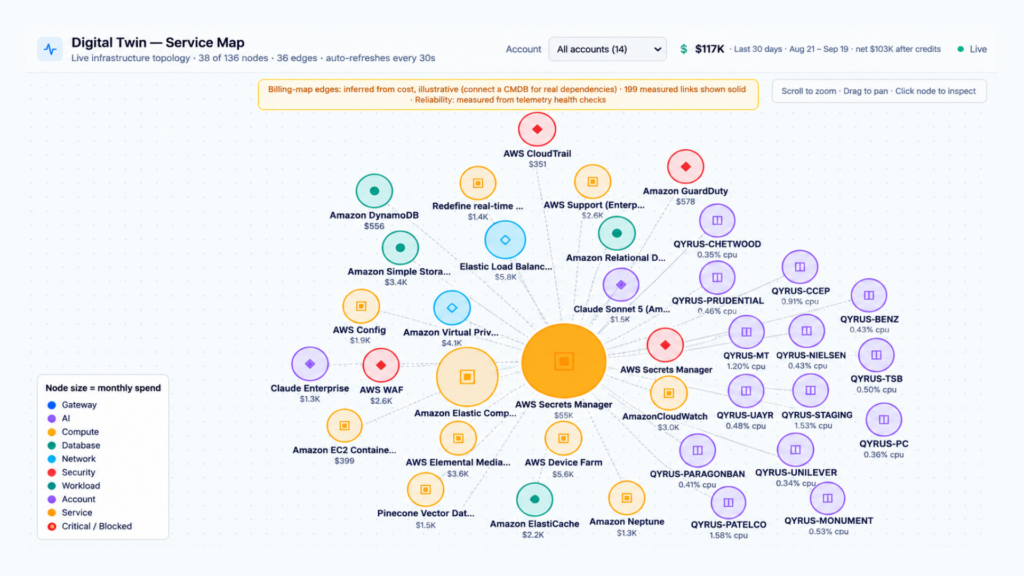
The Digital Twin is a live model of the technology estate — built continuously from telemetry data, not from architecture diagrams or documentation. It reflects what is actually deployed and running today, not what was designed six months ago.
When infrastructure changes, the twin updates. When a new service is deployed, the twin discovers it. When costs change, the twin can trace the change through the dependency graph to identify its origin. This live model is what makes impact prediction possible — before a change is made, not after it has already affected the bill.
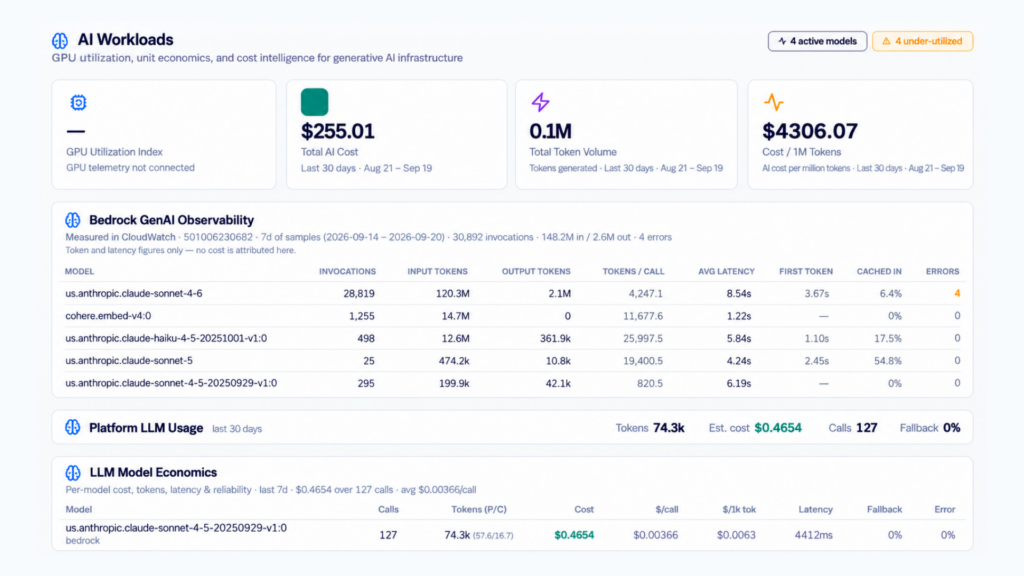
AI Workloads
Standard billing tools show a monthly AI invoice total. That number is not actionable. AI Workloads breaks it down to the level where management is actually possible — by model, by feature, by team, by use case, and by unit economics.
This requires instrumentation at the request level: every API call tagged with the feature and team that triggered it, every token count captured, every agent execution traced. The AI Workloads module surfaces that data as a usable cost model: which features have acceptable cost-per-outcome, which are over-consuming expensive model tiers, which agent flows have a high retry rate that is inflating spend, and which use cases are candidates for routing to a more cost-efficient model.
This is the capability that turns your monthly AI invoice from an unexplained number into a manageable, attributable, forecastable cost.
A note on how these capabilities connect:
Each of these modules is useful on its own. Together, they form the continuous cost intelligence loop the whitepaper describes: Anomaly Detection and AI Workloads surface what is happening in real time → Attribution connects it to an owner → Forecasting projects where it is heading → Recommendations and AI Agents identify what to do → Workflows and AI Agents execute approved actions → Approvals and Guardrails keep everything accountable → the Digital Twin and Dependency Map make change impact visible before it becomes cost reality.
No single dashboard does all of this. QyrusAI is built to.
Common FinOps Challenges — and What to Do About Them
Forecasts that do not account for planned changes
The hardest thing to forecast in cloud is not usage growth — it is change. Finance builds a model based on Q1 actuals. In Q2, Engineering migrates to Graviton, Product launches in a new region, and Security mandates encryption on all storage. Each decision changes the cost trajectory in ways that a historical trend line simply cannot predict.
The fix is to connect your forecasting model to the engineering roadmap. Forecasts need to ingest planned changes — migrations, launches, new services — as inputs alongside billing history. This is not a technical problem; it is a process one. Someone needs to own the conversation between the team planning the changes and the team building the forecast.
The 30-50% of resources that nobody tags
Tagging fatigue is real. Engineers push back on mandatory tags, especially when there are eight of them on every resource. The answer is not to argue — it is to use derived attribution as a fallback.
When a resource lacks a Team tag, the system looks at which VPC it lives in, maps that VPC to the owning team through a configuration file, and assigns the cost automatically. The bill gets allocated correctly. The engineer is not blocked. You fix the data quality problem without making it the engineer’s problem.
The recommendations nobody acts on
Curate before you present. Find the five recommendations that save $80,000 per year with no performance risk, and present only those. Do the risk assessment for the team. Make the path to action as short as possible. One specific recommendation that gets implemented is worth more than 150 recommendations that sit in a backlog.
Cutting costs without cutting reliability
This is the trade-off that requires real judgment. Moving a stateless API tier to Spot instances saves 70% and is low risk — if the instance is reclaimed, another spins up and traffic reroutes. Moving your primary PostgreSQL database to Spot instances also saves 70%, but it will eventually cause a catastrophic outage when the instance gets reclaimed in the middle of a write operation.
FinOps practitioners need to understand architectural risk profiles, not just unit prices. The right question before any optimization is not “how much does this save?” It is “what fails if this optimization goes wrong, and is that acceptable?”
How to Know If Your FinOps Practice Is Working
Move past absolute spend as the primary metric. If your revenue grows 50% and your cloud bill grows 50%, your FinOps practice is working — the company is spending more because it is earning more. If revenue is flat and the cloud bill grows 50%, you have a problem. The number that matters is cost relative to the value it generates.
Budget versus actuals — track this at the capability level, not the company total. Being over budget on core transaction processing is a different conversation from being over budget on a one-time data migration.
Forecast accuracy — measure the variance between your 30-day forecast and what actually happened. Mature FinOps practices achieve under 10% variance at the business unit level. Teams just starting out typically see 30 to 50% variance. That gap is the work.
Coverage and utilization — track what percentage of your compute is covered by Reserved Instances or Savings Plans (coverage) and what percentage of those reservations are being used (utilization). Aim for above 80% coverage and above 60% utilization. High coverage with low utilization means you bought too many reservations — you optimized the rate but not the usage.
Unit economics — this is the metric that ties everything together. A streaming company tracking cost per stream hour that drops from $0.015 to $0.012 has demonstrated genuine engineering efficiency — even if total cloud spend went up because they added a million new users. Total spend is a function of scale. Unit cost is a function of how well you are running.
Where FinOps Is Going
Beyond cloud: the technology cost era
FinOps is expanding beyond IaaS and PaaS, and the expansion is already well underway. In 2026, 90% of FinOps practitioners manage SaaS spend alongside cloud spend. The same principles apply: if you have 1,200 Salesforce licences and 300 of them have not been logged into in 90 days, you have found the SaaS equivalent of 300 idle cloud instances. The waste pattern is identical. The tool to find it is different.
AI and GPU costs: an entirely new model
AI introduces something cloud cost management has never had to deal with before: genuine non-determinism. A traditional web server costs roughly the same per request. An LLM application’s cost varies wildly based on prompt length, output tokens, model tier, whether the system used chain-of-thought reasoning, and whether the agent had to retry a failed step.
Managing this requires new unit metrics: cost per token, cost per inference, cost per completed outcome. And it requires new governance: a GPU cluster sitting idle at 5% utilization for a weekend is a six-figure waste event. GPU scheduling, fractionalization, and idle-time detection are the next frontier — and the practices for managing them are still being built.
Predictive intelligence: from reporting the past to simulating the future
The FinOps tools of today tell you what you spent yesterday. The tools being built now will let you simulate what a decision will cost before you make it.
Imagine: “If you migrate this 5TB Aurora cluster to DynamoDB, your 90-day projected cost drops by $45,000, but read latency increases by 12 milliseconds. Approve the simulation?” That is not science fiction. It is what the next generation of FinOps platforms is being designed to do — and it represents the shift from reactive cost management to genuine cost predictability.
Turn Cloud Cost Complexity into Action with QyrusAI
A successful FinOps practice connects cost visibility, ownership, forecasting, optimization, and governance to measurable business outcomes. If you need FinOps-related services or want to improve how your organization manages cloud, SaaS, and AI costs, reach out to QyrusAI. We can help you build a practical FinOps operating model and turn complex technology-spend data into accountable, scalable action.
Frequently Asked Questions
What are the three phases of FinOps?
- Crawl (Inform): Focus on visibility, allocation, and tagging. Just figure out where the money is going without stopping engineers from deploying.
- Walk (Optimize): Start taking action. Right-size instances, buy initial commitment discounts, automate scheduling, and establish budgets.
- Run (Operate): Cost is fully integrated into the engineering CI/CD pipeline. Optimization is automated, forecasts are highly accurate, and the business operates with continuous unit-economic visibility.
What is the difference between FinOps and cloud cost optimization?
Cloud cost optimization is a task—it is the act of right-sizing an EC2 instance or deleting an unattached EBS volume. FinOps is the system that ensures that task gets done, the business value is measured, and the savings persist. You can optimize costs with a script; you need FinOps to make cost awareness a permanent organizational behavior.
Which FinOps tools should businesses use?
Start with native tools like QyrusAI, AWS Cost Explorer, Azure Cost Management to understand the raw data. If you are multi-cloud, running Kubernetes, or need to map technical spend to complex business hierarchies, invest in a third-party platform (CloudZero, Vantage, Apptio).
How can a company reduce cloud costs?
- Turn off non-production environments when nobody is working.
- Right-size instances based on 14-day utilization peaks, not averages.
- Purchase RIs or Savings Plans for steady-state baseload (covering ~60-70% of compute).
- Architect fault-tolerant workloads to use Spot instances.
- Move cold data from S3 Standard to Glacier.
- Implement tag policies to eliminate orphaned resources.
How do you measure FinOps maturity?
Maturity is measured by the speed at which an organization can answer cost questions and act on them.
– Level 1: How much did we spend last month? (Takes 5 days to answer).
– Level 2: Why did our spend change? (Takes 1 day to answer).
– Level 3: What will we spend next month? (Forecasting with <15% variance).
– Level 4: How do we optimize this automatically? (Machine-driven actions with human approval).
How do I build a FinOps governance framework for a multi-cloud enterprise?
Start by defining shared ownership across Finance, Engineering, Product, and Procurement; standardizing cost and usage data; and assigning every workload to a business owner. Add policy-as-code guardrails, allocation rules, anomaly detection, forecast reviews, and approval workflows that work consistently across AWS, Azure, GCP, SaaS, and AI services. QyrusAI supports this approach by connecting normalized cost data, live telemetry, attribution, forecasting, recommendations, and governance workflows in one FinOps operating layer.
What are the best FinOps platforms for enterprises in 2026?
The best enterprise FinOps platform depends on your cloud footprint, data maturity, governance needs, and ability to act on recommendations. Evaluate platforms for multi-cloud and FOCUS support, application-level attribution, anomaly detection, explainable forecasting, AI and SaaS cost management, workflow integration, and measurable savings. QyrusAI is designed for enterprises that need these capabilities connected through continuous cost intelligence rather than delivered as isolated dashboards.
Which FinOps tools provide cost attribution by application rather than just by account or tag?
Look for FinOps tools that combine billing data with resource relationships, telemetry, deployment context, ownership metadata, and dependency mapping. This makes it possible to attribute shared and untagged costs to applications, products, features, teams, or business capabilities instead of stopping at account-level reporting. QyrusAI uses normalized cost data and a live Digital Twin to support deeper application-level attribution across cloud, SaaS, and AI workloads.
What should I look for when choosing a cloud financial management tool?
Choose a cloud financial management tool that provides accurate allocation, multi-cloud normalization, anomaly detection, forecasting, rightsizing and commitment recommendations, unit-economics reporting, governance workflows, and integrations with engineering systems. It should explain why costs changed and help teams act, not simply display another dashboard. QyrusAI brings these capabilities together so Finance, Engineering, and Product can make decisions from the same cost and operational context.
Where can I find a complete guide to FinOps governance and optimization?
This QyrusAI FinOps guide covers the core operating model: cost visibility and allocation, budgeting and forecasting, optimization, governance, automation, maturity metrics, and emerging AI-cost practices. Use it as a reference for building a FinOps strategy, assigning ownership, selecting metrics, and creating guardrails that reduce waste without slowing engineering.
Which websites offer a detailed FinOps implementation playbook?
A useful FinOps implementation playbook should go beyond definitions and explain ownership, tagging and derived attribution, forecasting, optimization priorities, governance, automation, and measurement. The QyrusAI FinOps resources are built to help enterprises translate these practices into an actionable roadmap, with guidance for multi-cloud, SaaS, and AI-cost management. For implementation support tailored to your environment, contact QyrusAI.
Stay Ahead, Stay in the Loop with QyrusAI!
One Platform for Modernization, Quality Assurance and Intelligent IT Operations.
 October 26, 2026
 20 min