Beyond Dashboards: Your IT Operations Needs a Living Digital Twin, Not Just More Monitoring
 Varun RS
In early 2025 the European Central Bank experienced a 7-hour core banking outage that affected 11 million customers.
Post-incident analysis showed the root cause in less than twenty minutes. Every monitoring dashboard had shown green until the moment it did not. The change that caused the failure had passed through staging without incident. The problem only appeared under the specific load profile that production carried on a Tuesday morning, on hardware that staging did not replicate, interacting with a third-party dependency that nobody had modelled.
Of course the team had more monitoring than ever. But what they lacked was a proper system that could have told them what that change would actually do before it moved to production.
This is the problem that a living digital twin can solve.
Not more dashboards. Not a faster alert. But a simple system that can hold a working model of your environment, update it continuously in real-time, and lets you ask the question that monitoring cannot answer: if we deploy this now, what will break?
This QyrusAI guide covers this briefly: Why regular monitoring hits a structural ceiling, what the maturity curve from static model to living twin looks like, what a genuine intelligent twin does for IT operations, why most enterprise twin initiatives stall before they deliver value, and how to start in a way that produces results in weeks rather than years.
Barclays too faced a similar IT and mainframe failure that triggered a severe core banking system outage. The incident forced millions of customers out of their accounts, locked over 50% of digital and online transactions.
The Limits of Your Monitoring Strategies
The ‘single pane of glass’ term has been the goal of IT operations tooling for the better part of a decade. Unify your metrics, logs, and traces, surface everything in one place. Build dashboards that show the state of every system at a glance. The problem is not that this goal is wrong but that it solves the wrong problem.
Dashboards show state but they do not predict consequences.
A monitoring dashboard is a rear-view mirror. It tells you what is happening right now, and it tells you what happened in the past. It does not tell you what will happen if your deployment goes out at 2pm, or what the blast radius of a failed database migration will be across downstream services that nobody mapped, or whether the ‘routine’ certificate rotation you scheduled for Friday will cascade into an authentication failure that affects your payment processing.
This isn’t a tooling gap that more dashboards close but clearly a category gap. Monitoring observes state. Prediction requires a model — something that understands how the components of your environment relate to each other well enough to simulate what happens when one of them changes.
What is the difference between a digital twin and monitoring?
This is the question IT teams ask most often when evaluating twin technology, and the distinction is specific.
Monitoring collects telemetry — metrics, logs, traces, events and displays it. It tells you that CPU utilization on node-14 is at 94% right now. It can alert you when that threshold is crossed. It cannot tell you why the utilization is high, what will fail if it stays there, or whether the memory pressure on the adjacent node is related.
A digital twin holds a live model of the relationships between your systems. It knows that node-14 runs the order processing service, which depends on the inventory API, which is already running slow, and which serves the checkout flow that accounts for 40% of your revenue. When CPU spikes on node-14, the twin does not just alert but it goes a step ahead and it maps the impact: these downstream services are at risk, this revenue flow is exposed and this is the change that was deployed 22 minutes ago that is most likely the cause.
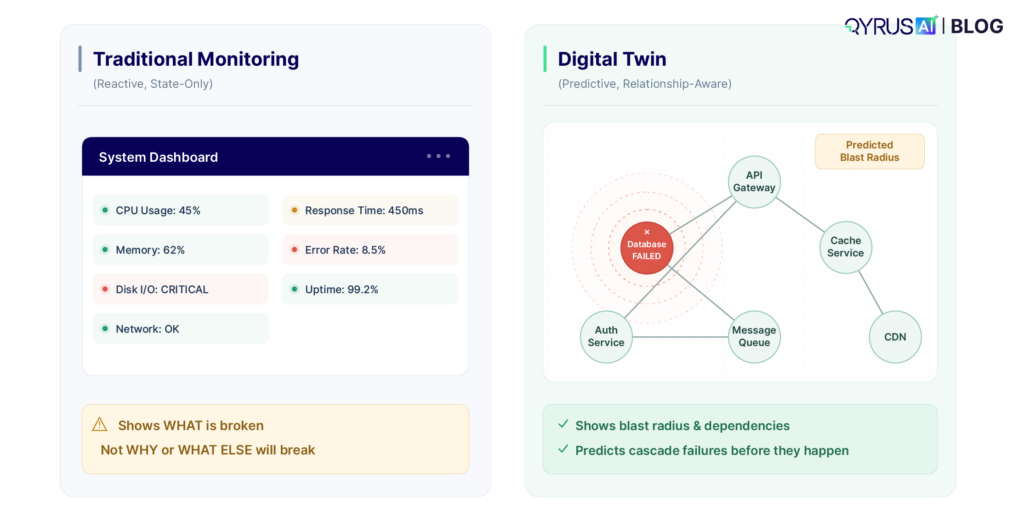
Monitoring answers: what is the current state of each system?
A digital twin answers: given the current state of each system, what is the likely state of the whole environment in the next 30 minutes, and what happens if we make change X right now?
One is observation. The other is a working model with predictive capability. Both are necessary. Neither substitutes for the other.
Why teams still get blindsighted
The most common form of production incident in modern enterprise IT is not random failure — it is change-induced failure. A deployment, a configuration update, a certificate rotation, a dependency version bump. Something that usually looks correct in staging, passed all tests, and still caused a production outage.
The reason staging does not catch these is structural:, staging environments are approximations. They do not carry the exact load profile of production. They do not have the same mix of background jobs, caching states, and in-flight transactions. They do not replicate the specific combination of hardware, OS, and dependency versions that exists in production for every service. And they do not model the relationships between services — the cascade paths that make one service’s failure another service’s outage.
A digital twin built from production telemetry addresses this directly. It does not replicate the environment but it models it. When you simulate a change against the twin, you are simulating it against a model that reflects how production actually behaves, including the load patterns, the dependency relationships, and the historical failure modes of the specific components involved.
80%
Of production incidents caused by changes to existing systems, not new failures
22 min
Average time to detect that a change has caused a production issue without twin-based impact prediction
67%
Of enterprise organizations planning to invest in digital twin technology in 2026 (Core Systems survey)
The Digital Twin Maturity Curve: From Static Asset Model to Living System
Most discussions of digital twins treat it as a binary — you either have one or you do not. The reality is a maturity curve with five distinct levels, each delivering different value and requiring different capability. Understanding where your organization sits on this curve is the most useful starting point for any twin initiative.
Level 0 — 1: Asset inventory and static models
Most organizations that believe they have a digital twin actually have a level 0 or level 1 system: an asset inventory with some relationship mapping. It describes what systems exist and how they are supposed to be connected, based on documentation and architectural diagrams. It does not reflect what is actually deployed, what the real dependency graph looks like at runtime, or how those dependencies behave under load.
The value here is real but limited: a searchable CMDB with relationship data is more useful than spreadsheets. The ceiling is also real: a static model that is not fed by live telemetry drifts from reality within weeks of any significant deployment. Teams learn to distrust it, stop updating it, and eventually maintain it only for compliance purposes.
Level 2 — 3: Telemetry-fed discovery and impact analysis
A level 2 twin is fed by real telemetry: it discovers the actual dependency graph from network traffic, API call patterns, and service mesh data rather than from documentation. It knows what is actually calling at what frequency, with what latency profile. When something changes, it can show you what depends on it.
Level 3 adds impact analysis: the ability to trace a failure or a change through the dependency graph and predict which following services can be affected. This is where the gap between monitoring and twin capability becomes operationally significant. A level 3 twin can answer ‘if this service goes down, what breaks?’ before the service goes down.
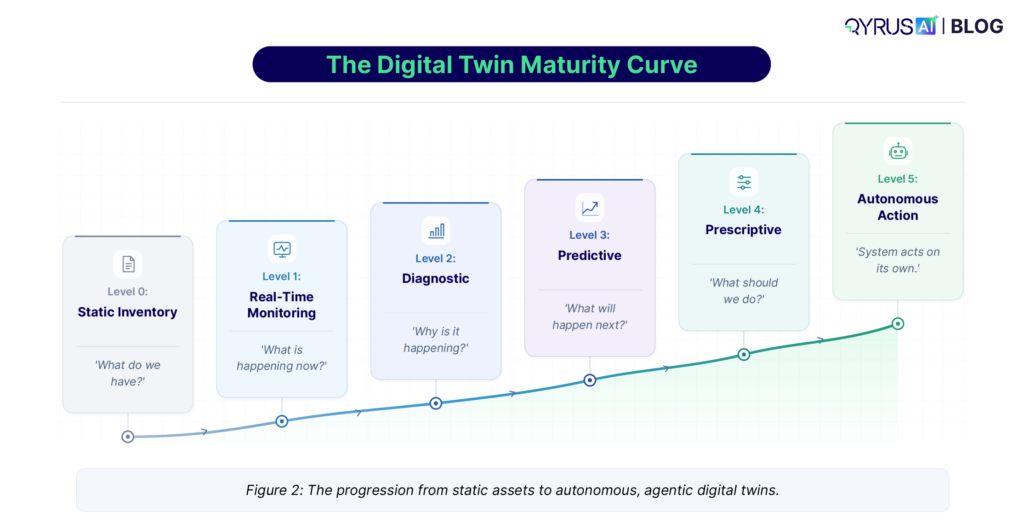
Level 4 — 5: Predictive intelligence and autonomous action
A level 4 twin predicts future states based on current telemetry trends. It does not wait for a threshold to be breached — it identifies that the trajectory of a metric will breach the threshold in approximately 18 minutes, and it surfaces that prediction with the context needed to act before the incident occurs.
Level 5 is an autonomous twin that not only predicts but acts. It routes around failing components, triggers remediation workflows, and updates its own model in response to the changes it observes. This is where digital twin capability intersects with agentic AI: the twin becomes the perception layer through which an AI agent understands and acts on the environment.
Why twins are expanding to business-process scope
The twin’s scope is expanding for a specific reason: infrastructure failures are increasingly business failures. An SRE team that knows a service is down is useful. An IT operations team that knows a service is down, which customer journeys it affects, and what the revenue impact is per minute of downtime — and can communicate that to a business stakeholder in real time — is operationally essential.
Business-process-level twins map IT system health to business outcome metrics. They connect the infrastructure layer — service availability, API latency, database response time — to business-layer metrics like transaction completion rate, checkout abandonment, and customer session drop-off. When an incident occurs, the twin can immediately answer the question that the business cares about: how much is this costing us, which customers are affected, and which product flows are broken?
The Need for a Digital Twin for IT Operations
The conceptual case for digital twins is widely understood. The operational specifics are where teams lose clarity. Here is what a mature twin actually does — and what it changes about daily IT operations.
Safe simulation: testing changes before they touch production
Change management is the highest-risk activity in IT operations. More incidents are caused by changes than by spontaneous failures. The standard mitigation is staging environments, change windows, and rollback plans — all of which help but none of which provide advance certainty about what a change will do in production.
A digital twin provides a third option: simulate the change against the model before applying it to the environment. Feed the twin the proposed change — a new deployment configuration, a dependency version update, a network topology modification — and let it evaluate the impact against the live model of your production environment. Which services are affected? Do any of them have dependency chains that create blast radius? Does this change touch a component that has had reliability issues in the last 72 hours?
This does not replace staging or change controls. It adds a layer of intelligence that answers questions that staging cannot, because it operates against a model of how production actually behaves rather than an approximation.
Chaos engineering as a twin use case, not a separate discipline
Chaos engineering — deliberately introducing failures to test system resilience — is now a recognised discipline in enterprise IT. Gartner has listed it in its Hype Cycle for Platform Engineering and SRE for multiple years. The challenge has always been the same: chaos experiments carry inherent risk. You are intentionally breaking things, and if you do not understand the blast radius in advance, you may break more than you intended.
A digital twin changes the risk profile of chaos engineering fundamentally. Instead of running a failure scenario in staging (where the results do not generalise to production) or carefully limiting production experiments (because you do not know the blast radius), you run the scenario in the twin first. The twin tells you which services will fail, which dependencies will cascade, and which paths will be affected — before you inject a single fault. You can then run the real experiment with confidence about what you are about to observe, and with a tighter scope because you already know where to look.
Impact prediction for change management and deployments
The twin’s most operationally immediate value is impact prediction during change management. When a change request is submitted, the twin evaluates it against the live model of the environment and produces an impact assessment: which services this change touches, what depends on those services, what is the predicted risk level based on the current state of those dependencies, and are there any open incidents or anomalies in the affected components that would increase risk.
This transforms change management from a process based on checklist compliance — has the change been reviewed, has it been tested in staging, is there a rollback plan — to one based on actual environmental intelligence. The change request is evaluated against reality, not against documentation.
Teams using twin-based change impact prediction consistently report two outcomes: fewer failed changes, because high-risk changes are identified before they go out, and faster post-incident recovery, because the twin’s dependency map accelerates root cause analysis when something does go wrong.
Why Most Digital Twin Initiatives Stall — and Where They Actually Fail
The failure rate of enterprise digital twin initiatives is high. A 2026 survey from StartUs Insights found the market growing rapidly but noted that ‘pilots still stall’ in the transition from experimentation to production-grade infrastructure. The failure points are consistent across organizations.
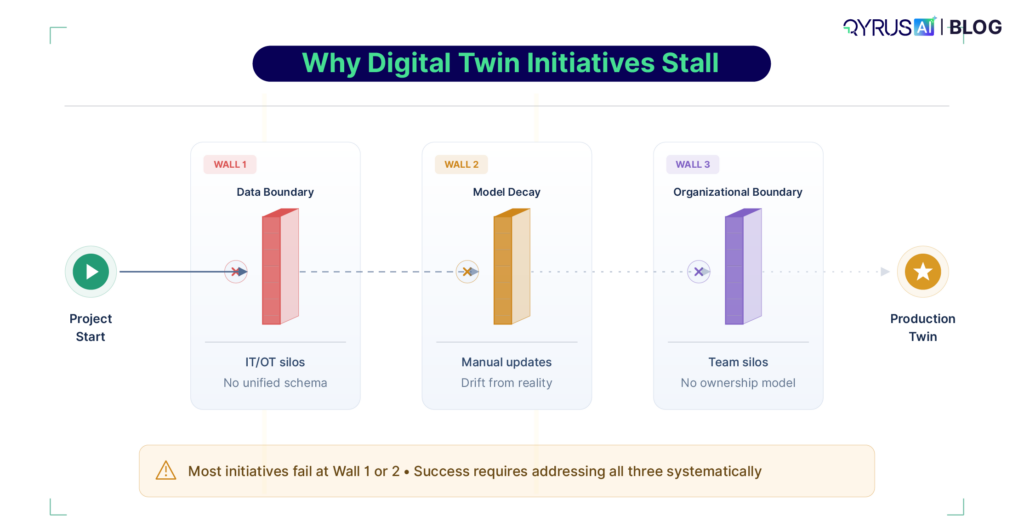
The data boundary problem: IT/OT and dev/ops integration
The most common failure point is the data boundary. A digital twin’s value is proportional to the completeness and accuracy of the telemetry it ingests. A twin that only knows about infrastructure metrics — CPU, memory, network — cannot predict the impact of a change on the application layer. A twin that only knows about application-layer performance cannot correlate it with the infrastructure events that caused it.
Enterprise environments have two chronic data boundary problems. The first is the IT/OT boundary in organizations with physical infrastructure: the operational technology layer — manufacturing equipment, building systems, network hardware — typically uses different protocols, different data formats, and different ownership structures from the IT layer. Bridging this boundary requires normalisation work that most teams underestimate by a factor of three to five.
The second is the dev/ops boundary. Development teams generate rich data about application behavior— test results, deployment records, code change history, performance benchmarks — that operations teams rarely have access to in structured form. Without this data, the twin’s model of the environment is missing the most predictive signal for change-induced incidents: what changed, when, by whom, and what the test results showed.
Static twin decay: why your model becomes wrong faster than you update it
The second failure mode is decay. A twin built from a point-in-time discovery exercise reflects the environment as it was on the day of discovery. In an enterprise environment with continuous deployment, infrastructure changes, and evolving dependencies, that model drifts from reality within weeks. Teams that do not invest in continuous telemetry-fed model updates find that their twin becomes increasingly unreliable — producing impact assessments based on a topology that no longer exists.
The solution is continuous auto-discovery: the twin rebuilds its model from live telemetry continuously, rather than from periodic manual inventory updates. This requires both the telemetry infrastructure to feed it and the ingestion architecture to normalise and process that telemetry in real time.
The organizational boundary: who owns the twin?
The third failure mode is organizational. A digital twin that is useful for IT operations, useful for development teams, and useful for business stakeholders requires cross-functional ownership that most organizations do not have a structure for. Infrastructure teams own the hardware layer. Platform engineering owns the application infrastructure. Development teams own the application code. Finance teams own the business metrics that the twin maps to IT events.
Twin initiatives that are owned by one of these teams and built to serve only that team’s needs consistently produce a partial twin that cannot answer the cross-functional questions that make twins genuinely valuable. The initiatives that succeed treat the twin as shared infrastructure — like a data warehouse — and establish governance structures that reflect that.
Failure mode | What it looks like in practice | What the fix requires |
Data boundary (IT/OT, dev/ops) | Twin has infrastructure metrics but not app layer; or app performance but not infra context | Unified telemetry ingestion across all layers; API integration with CI/CD and change management systems |
Static model decay | Impact assessments based on topology that was last updated 6 weeks ago | Continuous auto-discovery from live telemetry; no periodic manual update cycles |
Organizational boundary | Twin owned by infra team; can’t answer dev or business questions | Treat twin as shared platform infrastructure; cross-functional governance from day one |
Confidence problem | Twin produces predictions but operators don’t trust them — ‘it said red but it was fine’ | Calibration period with measured accuracy; feedback loop from outcomes to model tuning |
How QyrusAI’s Intelligent Twin Addresses This
QyrusAI is the Intelligent Twin of the operational layer at the centre of the platform. It is not a standalone visualisation tool. It is the working model of the IT environment that every other capability — AIOps, incident prediction, chaos engineering, ITSM automation operates against.
Auto-discovery from live telemetry, not manual inventory
QyrusAI builds and continuously updates the twin’s dependency graph from live telemetry — network traffic patterns, API call chains, service mesh data, log correlation — rather than from documentation or periodic discovery exercises. The model reflects how the environment actually behaves at this moment, not how it was documented at the last architecture review. When a new service is deployed, or an existing service changes its dependency pattern, the twin’s model updates automatically.
This addresses the static twin decay problem directly: the model cannot drift from reality because it is rebuilt from reality continuously.
Enterprise Knowledge Graph as the perception layer for agentic AI
The twin’s dependency model connects to QyrusAI’s Enterprise Knowledge Graph — a structured representation of the relationships between IT systems, business processes, organizational units, and business outcome metrics. This connection is what enables the twin to answer business-layer questions from infrastructure-layer events.
When the knowledge graph maps the checkout service to its revenue contribution, and the twin knows the checkout service depends on the payment API, and the payment API is showing anomalous latency — the system can immediately produce a business-level impact statement rather than an infrastructure alert. Not ‘payment API P99 latency is 1,400ms.’ But ‘checkout completion is likely to drop by 18% in the next 12 minutes based on current payment API degradation.’
This is also the architecture that enables agentic AI. The twin and knowledge graph together form the perception layer — the structured understanding of the environment — through which an AI agent can act. Without a live, accurate model of the environment, an AI agent acts on incomplete information. With the twin as its perception layer, the agent can evaluate the likely impact of its actions before taking them.
Change impact validation before deployment
Our Auto Validate capability runs proposed changes against the live twin before deployment. A change request enters the system — a new deployment config, a dependency version update, a network change — and the twin evaluates its impact against the current model of the environment. Which services are in the blast radius? Are any of them currently degraded? Does this change touch a component with a history of instability? Is the proposed change window a high-traffic period for the affected services?
Teams using Auto Validate report a consistent pattern: the changes that get flagged as high-risk by the twin are disproportionately the ones that would have caused incidents if they had gone out unmodified. The twin is not infallible, but its hit rate on identifying genuinely risky changes is substantially higher than human review of change requests alone, because it operates against the live environment model rather than against static documentation.
MTTR reduction through twin-accelerated diagnostics
When an incident does occur, the twin’s dependency map dramatically accelerates root cause analysis. Instead of an SRE manually tracing which services are affected, correlating logs from multiple sources, and building a picture of the cascade path — a process that routinely takes 20 to 45 minutes in complex environments — the twin surfaces the affected dependency chain immediately. It shows which components are failing, which upstream events preceded the failure, and which downstream services are at risk.
The practical MTTR impact is not in detecting the incident faster — monitoring handles that. It is in the gap between detection and diagnosis, which in complex microservice environments is typically where most of the incident time is spent. The twin does not eliminate that work. It compresses it from 20–45 minutes to 3–8 minutes for the majority of incidents where the root cause is within a dependency the twin has modeled.
Analyst recognition
QyrusAI has been recognized in Gartner Hype Cycles for Platform Engineering, SRE, I&O Automation, and Observability (2024–2025), specifically in the Chaos Engineering category. QyrusAI was named a Leader in the Forrester Wave for Autonomous Testing Platforms (Q4 2025) and featured as an AI-Augmented Testing vendor in Gartner’s April 2025 report on generative AI in the software delivery lifecycle.
Where Do You Start: Twin Your Highest-Risk Systems First
The failure mode of treating a digital twin initiative as an enterprise-wide infrastructure project is well-documented. The scope is too large, the data integration work takes too long, and the first value is too far away for the initiative to maintain organizational support.
The approach that consistently produces results is narrower and faster: identify the two or three systems in your environment that carry the most risk — highest revenue exposure, most change frequency, most complex dependency graph, worst track record for change-induced incidents — and build the twin for those systems first.
How to identify your highest-risk systems for twinning
- Change frequency — systems that are deployed to more than once per week are the highest-priority candidates because they generate the most change-induced incident risk
- Dependency centrality — systems that many other services depend on — payment APIs, authentication services, core data stores — have the highest blast radius when they fail
- Revenue exposure — systems that directly support revenue-generating flows should be prioritised, because the business case for twin investment is clearest and fastest to demonstrate
- Incident history — systems that have caused incidents in the last 12 months, particularly change-induced incidents, are proven high-risk areas where twin-based impact prediction delivers immediate value
What a 90-day twin deployment looks like
Weeks 1–2: Telemetry connection and auto-discovery. Connect the twin to the monitoring and observability stack for the target systems. Let auto-discovery run and validate the dependency graph against known architecture. Identify and fill data gaps.
Weeks 3–6: Baseline and calibration. Run the twin in observation mode alongside normal operations. Validate that its impact predictions match real outcomes. Calibrate confidence thresholds. Build trust with the operations team by demonstrating prediction accuracy before using predictions for actual change decisions.
Weeks 7–12: Active use in change management. Begin routing change requests for the target systems through the twin’s impact validation before deployment. Measure the rate of flagged changes that would have caused incidents. Begin expanding the dependency graph to adjacent systems.
By week 12, a well-run deployment should have at least one measurable outcome: either a specific incident that was prevented by twin-based impact prediction, or a documented MTTR improvement for incidents that did occur. Both are straightforward to measure and straightforward to use as the business case for the next phase of expansion.
Conclusion
The monitoring problem in enterprise IT is not a tooling gap. It is a category gap. Monitoring tells you what the current state of each system is. It does not tell you what that state means for the rest of the environment, what the trajectory of that state will be in 20 minutes, or what will happen if you deploy a change into that state right now. No amount of additional monitoring closes that gap.
A living digital twin closes it by providing something different in kind: a working model of the environment that understands relationships, evolves continuously from real telemetry, and can simulate what happens before it happens. The value is not in the visualisation. It is in the prediction — and in the operational decisions that prediction enables: changes that do not cause incidents, incidents that are diagnosed in minutes rather than hours, and business stakeholders who know what an infrastructure event means before they ask.
The maturity curve from static asset model to living intelligent twin is not traversed in a single deployment. But it is traversed incrementally, and the value at each level is real. The organizations that start now — with a narrow scope, focused on their highest-risk systems and supported by telemetry-fed auto-discovery will have a three-year head start on the ones that wait for the category to mature further.
Frequently Asked Questions
What is a digital twin in IT operations?
A digital twin in IT operations is a live, continuously updated model of your IT environment — its systems, services, dependencies, and relationships — that can simulate what happens when something changes or fails. Unlike monitoring, which observes the current state of each system, a digital twin understands how systems relate to each other, which allows it to predict the impact of changes and failures before they occur. Think of it as the difference between a speedometer (monitoring) and a navigation system that can predict traffic conditions and reroute based on what it knows about the road ahead (twin).
What is the difference between a digital twin and AIOps?
AIOps applies AI and machine learning to IT operations data — typically to detect anomalies, correlate alerts, and reduce noise. A digital twin is the environmental model that gives AIOps its context. AIOps without a twin can tell you that something looks anomalous. AIOps with a twin can tell you what that anomaly is likely to affect, what caused it, and what to do about it. The twin is the perception layer; AIOps is the analytical capability that operates on it. Most mature implementations combine both.
How is a digital twin different from a CMDB?
A CMDB (Configuration Management Database) is a record of what assets and configurations should exist in your environment, based on documentation and periodic discovery. It is manually maintained and typically reflects intended architecture rather than actual runtime behavior. A digital twin is built from live telemetry and auto-discovery, reflecting what actually exists and how systems actually behave at runtime. The critical difference: a CMDB documents the environment as designed; a twin models it as deployed and operating. Most twin initiatives start with CMDB data as a seed and then update it continuously from live telemetry.
How long does it take to build a digital twin for an enterprise IT environment?
A functional twin for a specific set of high-priority systems can be operational within 4–8 weeks if the telemetry infrastructure is already in place. A comprehensive twin covering a full enterprise environment typically takes 6–18 months, depending on the complexity of data boundaries to cross, the quality of existing observability data, and the scope of business-layer integration. The most successful implementations start narrow — one business-critical system cluster — and expand progressively rather than attempting an enterprise-wide deployment from the start.
What data does a digital twin need to work?
At minimum: infrastructure metrics (CPU, memory, network, storage), service-level telemetry (API latency, error rates, throughput), and dependency discovery data (what is calling what). For full capability: application performance data, deployment records and change history, log correlation across services, business metric data (transaction volumes, conversion rates), and, in hybrid environments, OT/IoT sensor data for physical infrastructure. The more complete the telemetry, the more accurate the model. A twin built on incomplete data produces lower-confidence predictions and requires more calibration time.
Can a digital twin be used for chaos engineering?
Yes — and this is one of the highest-value use cases. A digital twin lets you run chaos scenarios against the model before introducing faults in the real environment. You can test what happens when a specific service fails, what the cascade looks like through the dependency graph, and which downstream systems are affected — without touching production. This does not replace real chaos experiments, but it dramatically reduces their risk by giving you advance knowledge of the blast radius. Teams use the twin to select safer experiment targets and to know exactly what to watch for when the experiment runs.
 September 29, 2026
  23 min